


Chicken tikka masala is usually about 230 to 875 calories per package, depending on whether you're looking at a lighter version or a standard one. That wide spread happens because the same dish name can hide very different amounts of cream, oil, sauce, and portion size.
The confusing part is that your curry app isn't broken. It's trying to solve an uncertainty problem, and chicken tikka masala is one of the clearest examples of why a dish name alone can't give you a single clean number. Two plates that look similar can land very differently once you factor in the sauce, the chicken-to-gravy ratio, and whether rice or naan is part of the meal.
Table of Contents
- Why One Chicken Tikka Masala Number Is Never the Whole Story
- Where Chicken Tikka Masala Actually Comes From
- What Actually Drives the Calories in Your Plate
- Real Calorie Ranges Across Portions and Brands
- How Calorie Genie Estimates Your Plate and How to Correct It
- Beyond Calories: Protein, Fat, and Sodium Tradeoffs
- Your Logging Workflow for Chicken Tikka Masala
Why One Chicken Tikka Masala Number Is Never the Whole Story
Chicken Tikka Masala Calories are better thought of as a range than a fact you can look up once and reuse forever. That's because the dish changes with the cook, the restaurant, the supermarket brand, and even the day's serving size. A calorie number only means something when you know what portion it describes and how the sauce was made.
The dish name hides the variables
A grilled chicken piece brings protein, but the calorie swing usually comes from the creamy tomato sauce, oil, butter, and whatever starch sits next to it. The same label can describe a light lunch, a packed takeaway container, or a restaurant plate with a generous pour of sauce. That's why a “one number fits all” approach keeps failing in calorie apps.
Practical rule: Treat the dish name as a clue, not a calorie value. The real estimate starts with portion size and prep style.
The cleanest way to think about it is simple. Ask what you ate, not what the recipe is called. Did you finish the sauce? Was it rich and creamy, or more tomato-heavy? Did you eat the rice too?
That mindset matters because the dish is not standardized in the way a packaged bar or a labeled snack might be. For tracking, the question is always the same: how much of the plate belonged to the curry, and how much came from sides and extras? If you answer that, your estimate gets much closer.
Where Chicken Tikka Masala Actually Comes From
The history helps explain the calorie spread. The most repeated origin story places chicken tikka masala in Glasgow in the 1970s, tied to Ali Ahmed Aslam and the Shish Mahal restaurant, which opened in 1964, but the story can't be proven conclusively. Food historians have also linked it to northern Indian butter chicken, which makes the dish look less like one fixed invention and more like a travel-friendly adaptation that kept changing as it moved.
That matters because a dish that evolves across restaurants and home kitchens never settles into one rigid formula. A mild, creamy version in one place can be much richer than a tomato-forward version elsewhere. Over time, the recipe becomes a family of meals, not a single recipe card.
A dish shaped by adaptation
By 2009, Glasgow politicians were even campaigning for recognition of chicken tikka masala as part of the city's culinary heritage, which shows how Britain had adopted it. That cultural spread is part of the calorie story, too. Once a dish gets copied, simplified, and remixed in takeaways and supermarkets, the sauce gets thicker, thinner, sweeter, richer, or lighter depending on who's cooking.
So when people ask for the calories, they're really asking about a moving target. The dish name stayed the same, but the fat, cream, and portion size didn't. That's why a good estimate should always be tied to a specific plate or package, not to the title on the menu.
What Actually Drives the Calories in Your Plate
The sauce does most of the calorie work here. Chicken brings protein, but cream, butter, oil, and a bigger scoop of gravy can push the total up fast. Rice and naan add their own calories too, even if the curry itself looks unchanged.
Sauce-to-chicken ratio matters most
A lighter recipe can stay near the lower end of the range, while richer versions climb quickly. One institutional label lists 165 calories per 4 ounces with 13.5 g protein, 5.6 g saturated fat, and 371 mg sodium from the University of Connecticut. A University of Maryland label lists 170 calories per 4 ounces with 16.6 g protein, 1.3 g saturated fat, and 151 mg sodium (University of Maryland nutrition label). The calories are close, but the sauce profile is clearly different.
A glossy, heavy sauce usually means more calories per bite. A thinner tomato-based version leaves more room for the chicken itself.
Sides change the estimate too. Rice and naan need separate entries because they can add a lot to the meal without changing the curry label at all. If you log only the curry, you miss part of the plate. If you log only the plate name, you miss the breakdown that explains why the number looks the way it does.
Photo-based tracking works best when it follows what the eye can see. A creamy pool of sauce, a half-finished bowl of rice, or a thick layer of buttered masala are not small details. They are the clues that turn a rough guess into a better estimate.
Real Calorie Ranges Across Portions and Brands
The numbers below make the spread easier to see. They don't prove that one version is “right,” they show how much the same dish can vary once serving size and recipe change.
| Source | Portion | Calories | Protein (g) | Fat (g) | Sodium (mg) |
|---|---|---|---|---|---|
| University of Connecticut label | 4 oz | 165 | 13.5 | 5.6 saturated fat | 371 |
| University of Maryland label | 4 oz | 170 | 16.6 | 1.3 saturated fat | 151 |
| Packaged Ahold formulation | 140 g | 230 | 19 | 14 | 790 |
| World Cancer Research Fund recipe | serving | 253 | not listed | 4.3 | not listed |
| University dining label | 4 oz | 165 | not listed | 9.2 | not listed |
| Light homemade recipe | 3/4 cup | 249 | not listed | not listed | not listed |
| Slow cooker recipe | 1/4 recipe, about 1 1/2 cups | 254 | 24 | 11 | 538 |
| Typical restaurant entrée | entrée | 800 to 1,200 | not listed | not listed | not listed |
The wide range tells you which estimate to trust for your own meal. If you cooked it at home and used a measured portion, a recipe-style reference is a reasonable start. If you bought a packaged meal, the label is the better anchor. If you ate at a restaurant, the entrée estimate is usually closer than a neat database entry.
The other lesson is portion size. A 4-ounce reference is not the same as a full restaurant bowl, and a 3/4 cup homemade serving isn't the same as a packed takeaway container. For a related example of how portion-based logging changes the estimate, see this guide on calories in sliced turkey breast.
How Calorie Genie Estimates Your Plate and How to Correct It
A photo-first tracker starts with what it can see. It identifies the dish, estimates the portion, and turns that into calories and macros without forcing you to hunt through a food database by hand. That matters for chicken tikka masala, because the same dish can arrive as a bowl, a tray, or a half-finished plate with rice on the side.
Calorie Genie AI follows that workflow in a few steps. You snap the meal, review the estimate, and then correct anything the photo could not judge well. If the sauce was extra creamy, say so. If the chicken was cooked in butter, note that. If you only ate half the rice, log that part separately. For packaged supermarket meals, the barcode scanner is the cleaner route. For restaurant food, the menu scanner fits better, since the dish already comes with a label of sorts. For an overview of how photo-based estimates and plain-language corrections work, see how Calorie Genie handles meal estimates and edits.
What to correct first
Start with the biggest sources of drift.
- Sauce richness: Creamy or buttery sauce pushes the estimate up.
- Rice or naan: Log both separately so the curry does not absorb their calories.
- Leftovers: If you did not finish the plate, adjust the entry to match what stayed behind.
- Container size: A takeaway tray often means more food than a standard database serving.
The goal is not a perfect number. It is a number that matches the meal closely enough to use. That is the value of photo-based tracking here. The image gives you a fast first pass, then your corrections fill in what the camera cannot know, especially with mixed dishes where sauce, rice, and portion size all pull the estimate in different directions.
Beyond Calories: Protein, Fat, and Sodium Tradeoffs
A calorie count can look tidy while the rest of the label tells a messier story. That is why two chicken tikka masala options with similar energy can still feel very different at the table, especially once you care about fullness, salt, and how the meal fits the rest of the day.
The packaged trays already show that split clearly. One packaged product comparison lists 370 calories per 255-g tray, 25 g protein, and 630 mg sodium. Another lists 360 calories per 8-ounce serving and 480 mg sodium. The calorie gap is small, but the protein payoff and sodium load are not the same. Protein per calorie is higher in the first product, while the second looks lighter on sodium for the serving size shown.
That is the part many app screens blur together. A lower-calorie meal is not automatically the better fit if it leaves you hungry sooner. A higher-protein tray can work more like a steadier anchor, especially for lunch or dinner when you want the curry to carry the meal instead of just fill the plate.
Sodium deserves the same attention. Two trays can sit near each other on calories and still point in opposite directions on salt, which matters if the rest of your day already includes bread, cheese, sauces, or other processed foods. For home cooking, the spread is wider still. A recipe that leans on tomatoes and spices will usually read very differently from one built with cream or butter, even before rice enters the picture.
The simplest way to read the label is to ask three questions: how many calories, how much protein, and how much sodium for the portion you will eat. That keeps the focus on the full tradeoff, not just the headline number.
Your Logging Workflow for Chicken Tikka Masala
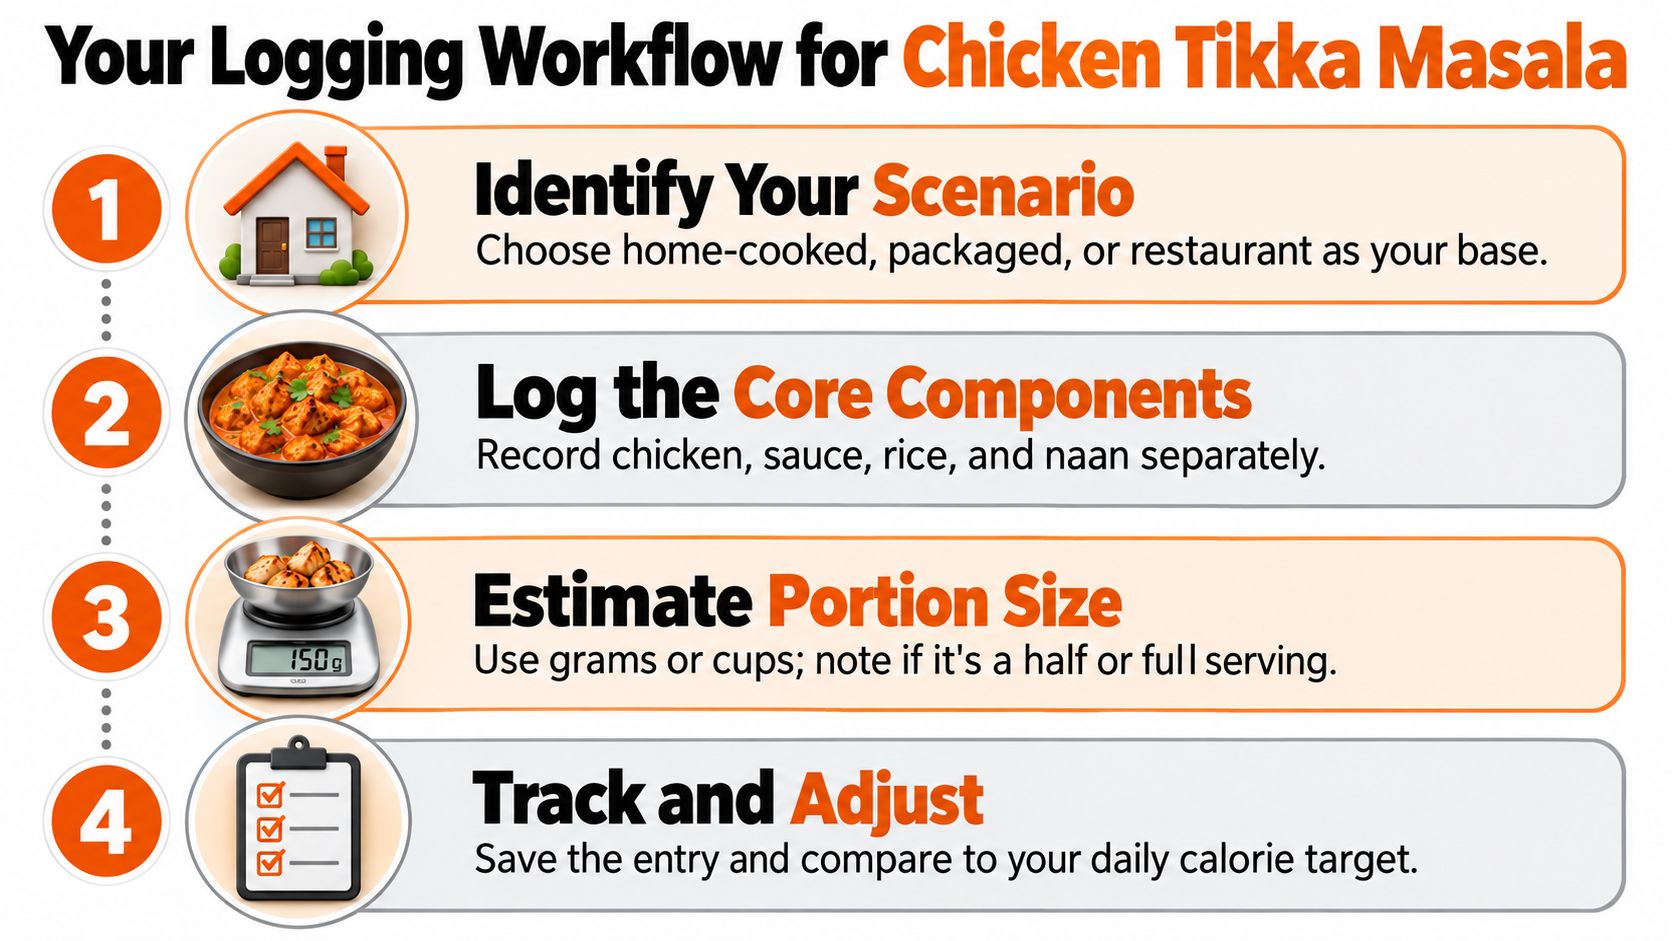
One curry can look simple and still produce very different calorie counts. The cleanest way to log it is to treat calories as an estimate shaped by portion, sauce, and prep, then narrow that estimate step by step. Start with the setting, home-cooked, packaged, or restaurant. Use a photo, label, or menu scan for a baseline, then correct the obvious parts in plain English and keep the starch separate.
A simple checklist you will keep using
- Choose your base: Home meal, packaged tray, or restaurant order.
- Log the curry first: Chicken, sauce, and visible fat all matter.
- Add the sides separately: Rice and naan should not disappear into the curry estimate.
- Adjust with plain words: Extra creamy sauce, cooked in butter, half the rice, or leftovers eaten later.
The Calorie Genie blog fits that kind of logging because it keeps the process practical for everyday meals. You do not need a perfect measurement to stay consistent. You need a repeatable habit that gets close enough to use and is easy enough to keep doing.
A curry app should answer a plain question, what did I eat? If you want a photo-first way to estimate the next plate, correct the sauce in plain language, and keep rice and naan separate, snap your next meal with the app introduced above.